

How many videos per month does a DTC brand need?
There is no universal monthly number, but paid creative testing gives one defensible figure. At the ~5% win rate Motion measured across $1.29B of Meta ad spend, you need roughly 20 creatives per winner on average, and about 45 for a ~90% chance of at least one winner. For organic posting, no optimum frequency is settled.
At a glance:
- Paid testing: ~20 creatives per winner on average, from Motion Creative Benchmarks 2026.
- ~90% chance of at least one winner: ~45 creatives, our calculation from Motion's ~5% rate.
- One TikTok campaign: 9–25 creatives, our multiplication of TikTok's 3–5 creatives × 3–5 ad groups.
- Organic Instagram, observed: ~20 posts a month, from Socialinsider's Instagram benchmarks, 35M posts.
- Organic optimum: not settled, because Buffer and Dash Social disagree, and consistency is better evidenced than volume.
- Creative refresh: before performance declines, per Meta's creative-fatigue research.
- Cost: at least $7,000 for 20 UGC videos at our $350 floor, a lower bound rather than a quote.
Two caveats run through every one of those numbers. First, a creative is not a production: hooks, cuts and aspect-ratio variants from one shoot each count as a separate creative, so the number of videos you commission is smaller than the creative count. Second, nobody in this article is neutral. Dream Aspect is a Los Angeles production company that sells video volume, so we have an obvious interest in the answer being more video, so the evidence against volume gets its own section here.
Every source here is commercially interested too. Motion, Buffer, Dash Social, Socialinsider and Metricool sell software to the audience for their own findings, and Meta and TikTok sell the ad inventory the numbers are about. We checked each publisher's own product pages on 21 August 2026 rather than inferring the business from the study. There is no disinterested source in this article, and we would rather you know that than discover it.
How many ad creatives do you need per month to find one winner?
About 20 creatives per winner on average at Motion's ~5% win rate, and about 45 if you want to be confident of getting one. Motion analysed $1.29 billion in realised Meta ad spend across 578,750 unique creatives and 6,015 advertiser accounts between September 2025 and January 2026. In that dataset roughly 5% of creatives are winners, where a winner reaches at least 10× the account's median spend and at least $500.
A 5% rate makes 20 creatives the average needed per winner. It does not make 20 sufficient. At a 5% independent rate, 20 attempts produce at least one winner about 64% of the time, which leaves roughly a one-in-three chance of twenty creatives and nothing to show for them. For 90% confidence you need about 45. Twenty is a mean with a large failure tail, so planning to it means planning to be disappointed a third of the time.
Motion is an ad-insights vendor, and this is its own dataset. Its home page headline is "Ship more winning ads," and the platform promises to "Make better ad creative" and to "turn performance insights into winning creative" (retrieved 21 August 2026). Its customers are the advertisers running high creative volume, so its interest points the same way as ours. It is also our only source for the win rate, which makes it the weakest joint in the paid calculation: we have no second source for that number.
TikTok's advertiser documentation, last updated June 2025, is more prescriptive. It recommends "between 3-5 different creatives per ad group and 3-5 diversified ad groups per campaign." Our multiplication, not TikTok's recommendation, puts a properly structured campaign at 9 to 25 creatives before you have tested anything. TikTok's page is prescriptive guidance with no sample disclosed, so treat it as a structure, not a study.
One caveat cuts against Dream Aspect. Motion counts unique creatives, which in practice includes hooks, cuts and aspect-ratio variants built from the same footage, and one shoot or one UGC video can yield several. Anyone converting Motion's creative counts directly into a video order, including a production company quoting you, is overstating what you need to shoot.

Why does paid creative stop working, and how often should you refresh it?
Creative fatigue is the decline in an ad's performance as the same people see it repeatedly, and it is the one part of this question with experimental evidence. Meta's analytics team published research in 2023 reporting that "at 4 repeated exposures the associated likelihood of a conversion drops by about 45%." Meta's own word is associated: that figure is a modelled association, not a causal measurement, and we are not going to upgrade it.
The same Meta post is inconsistent about what the 45% measures. The model is "a logistic regression that predicts the likelihood of a click," and Meta states the result as "the reduction in likelihood of a click follows the shape of (N+1)^-.43" before converting it in the next sentence to a drop in "the associated likelihood of a conversion." A 45% fall in click-through is a much smaller claim than a 45% fall in conversion, and nothing in the post bridges them. The inconsistency is Meta's; flagging it is ours.
The causal result sits underneath it. Meta ran what it calls a “simple two cell split test with two phases” across “roughly 26 thousand cases”: the first 7 days establish “a distribution of fatigue levels,” and the second 7 measure what happens when new creative is added. Meta found that acting on fatigue guidance "can improve conversion rate by on average 8% for high fatigue cases" and concludes: "This suggests that adding in new creative into fatigued ad sets has an overall causal improvement in conversion rates."
That 8% is a modest effect from a controlled experiment, and it is the strongest evidence in this subject. Meta never uses the word randomised, and neither do we. The two cells are not described in any text of the Meta post we can retrieve (Medium blocks direct access, so we read it through a text-extraction service), which means what was held constant in the control cell is not stated and the test cannot be independently appraised.
Fatigue is already common on Meta. According to the same source, "The mean count of user/creative previous exposures across all Meta ad impressions is 4.2 with over 19% of ad impressions having been seen more than five times." Those counts are "produced over a 30 day lookback window," and Meta says repetition is especially prevalent in ads optimised for link clicks and offsite conversions, while brand advertisers see far less of it because of frequency caps. If you run brand campaigns with frequency caps, the 4.2 is not your number.
TikTok's refresh guidance is a trigger rather than a calendar: replace creative "when delivery results exhibit a consistently declining trend, or when daily new users are low." Meta also names a remedy that costs no production at all: "Alternatively to refreshing creative, targeting new audiences could also resolve this problem." Meta adds that the finite size of audiences still creates a strong motivation to develop new creative, but the order matters. If your audience is nowhere near exhausted, expanding targeting is the cheaper lever.
So the real argument for producing more is narrower than the one agencies usually make. It is not that more content performs better. It is that the creative you are running degrades with exposure, and once your addressable audience stops growing, you need replacements ready before performance tells you so. For a seasonal refresh schedule, see how many new ads to have ready for November and December.
How often should a DTC brand post on Instagram?
Nobody knows for sure, because the two largest studies that relate Instagram posting frequency to an outcome, from Buffer and Dash Social, reach opposite answers. Buffer analysed 2.1 million posts from 102,000 Instagram accounts in August 2025 and found that follower growth rose with frequency at every step:
- +0.12% weekly at 1–2 posts a week
- +0.26% at 3–5 posts a week
- +0.44% at 6–9 posts a week
- +0.66% at 10 or more posts a week
The Buffer study records the taper in its own words: "Even at higher frequencies, there are still meaningful 20-25% incremental gains for posting more frequently, however the returns are diminishing." Dash Social analysed nearly 1.5 million Instagram feed posts from roughly 3,000 brands between July 2025 and June 2026 and found a peak rather than a slope: "Brands that posted 2 to 3 times per week to their feed saw significantly higher engagement rates than those posting more or less frequently."
The tempting explanation is that Buffer and Dash Social measure different things, and it is only partly right. Buffer reports reach per post rising with frequency; Dash Social reports an engagement rate falling. Both are per-post, but reach per post rising while an engagement rate falls is an ordinary dilution pattern rather than a contradiction. We cannot go further, because Dash Social's page never states what its engagement rate divides by; we looked for one and found none.
What really differs between the Buffer and Dash Social studies is the population and the method. Buffer's sample is 102,000 accounts; Dash Social's is about 3,000 brands on an enterprise platform. Both are vendor analyses of their own customers, neither is experimental, and neither controls for the obvious confound: accounts that post more tend to have more people and more budget, which independently drive growth. So the honest position is that organic posting frequency is not settled.
Larger Instagram datasets exist, but they report what brands do, not what frequency achieves. Socialinsider analysed 35 million Instagram posts from 447,613 pages across 2025 and found brands posting roughly 8 Reels, 7 images and 5 carousels a month, about 20 posts. Metricool's 2026 Instagram Study covers 24,364,803 posts from 375,118 accounts and reports posting volume up 24% year on year.
Socialinsider's format data is more useful than its cadence data. Measured as engagement per follower, carousels averaged 0.55% in 2025, Reels 0.52% and images 0.37%. That divides by followers, while Dash Social's rate divides by something undisclosed, so the two are not comparable. Metricool points the other way on format: it recommends Reels for reaching new audiences and, on its Instagram trends analysis, reports Reels engagement rate up 24.76% against single-image posts down 45.98% (both Metricool pages checked 24 August 2026). Within one dataset, format is a lever you can pull this week without producing anything more. For engagement benchmarks by platform and account size, see what a good engagement rate is in 2026.
What does the evidence say against making more videos?
Three findings cut against volume, and Dream Aspect is not going to pretend otherwise. The sharpest comes from Buffer, which measured consistency, the thing a production company is not selling.
- Consistency is better evidenced than frequency. Buffer's consistency study across more than 100,000 users and all major platforms found "the highly consistent posters saw more than 5 times the engagement per post compared to those who posted sporadically" while noting "this analysis didn't take into account the impact of posting multiple times per week." Showing up reliably was measured; posting a lot was not.
- Buffer qualifies its own headline. The Buffer frequency study quotes its data scientist Julian Winternheimer saying "However, there is a big caveat that the most important factor probably remains content quality", under a section headed "More does not always mean better".
- TikTok says frequency cannot rescue weak creative. TikTok/System1 research across 8,000 heavy TikTok users in six markets, which "deliberately induced creative fatigue by exposing consumers to a range of ad frequencies over the course of a single session", found that "High frequency cannot save poorly performing ads."
The TikTok/System1 study is published by TikTok For Business as marketing content, its underlying study is not released, and TikTok sells the inventory more creative would fill. We use it only because its finding argues against us. Granting causal weight only to the experiment that suits you is the easiest way to mislead with a correctly cited source, so both the Meta and TikTok designs are flagged here.
Motion supplies the honest frame for the whole question. It writes that "Winners are statistical outliers. The more ads an account tests, the more chances the account has to produce one" and uses it as the caption to a finding about enterprise advertisers shipping 18.8 creatives a week. Volume does not improve your creative. It buys more attempts at an unchanged success rate, and if that rate is near zero, twenty attempts produce twenty losses when the money would have been better spent on one good idea.
How many videos a month should you budget for next quarter?
Work backwards from testing rather than from a posting calendar, and set the number by what you can afford to test properly. If paid is part of the plan, Motion's base rate gives a range of about 20 creatives per winner on average and closer to 45 for reasonable confidence, and TikTok's guidance implies 9 to 25 to structure a single campaign. Several creatives can come from one production, so the video count is lower than the creative count. For worked examples, see three Q4 content budgets.
For organic, the honest benchmark is what comparable brands do, about 20 Instagram posts a month in Socialinsider's 2025 data, rather than a proven optimum. Consistency is better evidenced than frequency, and format choice is the cheapest lever available. The question worth asking is not "how many videos" but whether your hit rate is good enough to justify the attempts. If you cannot estimate your own hit rate, that is the thing to fix first, and it costs nothing to work out. For how a feedback loop tracks it, see what a content production engine is.
What does 20 or 45 videos a month cost at Dream Aspect's published rates?
Dream Aspect publishes per-unit rates rather than a monthly package, so you can do the multiplication yourself. As of 5 October 2026, these are the figures on our own pages:
- UGC video: our UGC page says "On average, pricing starts at $350 per video", with a minimum of 5 per batch, 14–30 day production and usage rights typically 6 months.
- Social-media video package: Dream Aspect's homepage says packages start at $3,000 per shoot. The video production page publishes no price, stating only that cost "varies based on the scope of work and deliverables."
- 2D CGI: our CGI page gives "~$70/sec on average", because simple 2D "usually takes around 1 production hour per second."
- Complex 3D CGI: "~$300–1,000+/sec", because it "may require 6–10+ hours per second."
The $350 and the $3,000 are floors, while the ~$70 per second is an average that can move in either direction. Twenty UGC videos at the $350 floor is at least $7,000, and forty-five is at least $15,750. Two forces pull the real number away from those figures. Downward: one video does not equal one creative, so you may need fewer videos than the creative count implies. Upward: $350 is what the cheapest qualifying video costs, anything with more scope costs more, and there is a five-video batch minimum underneath it all.

So $7,000 is a lower bound, not an estimate, and Dream Aspect cannot narrow it without knowing your scope. Any agency, us included, that multiplies a floor by a quantity and calls the result a budget is showing you the best case. We do not publish a monthly retainer price or a standard monthly asset count yet; until we do, we would rather show per-unit rates than quote a package we have not defined. If the multiplication pushes you toward hiring instead, we have costed that out in in-house social team vs agency, including the payroll loading most comparisons leave out.
Did higher video volume work for a real brand?
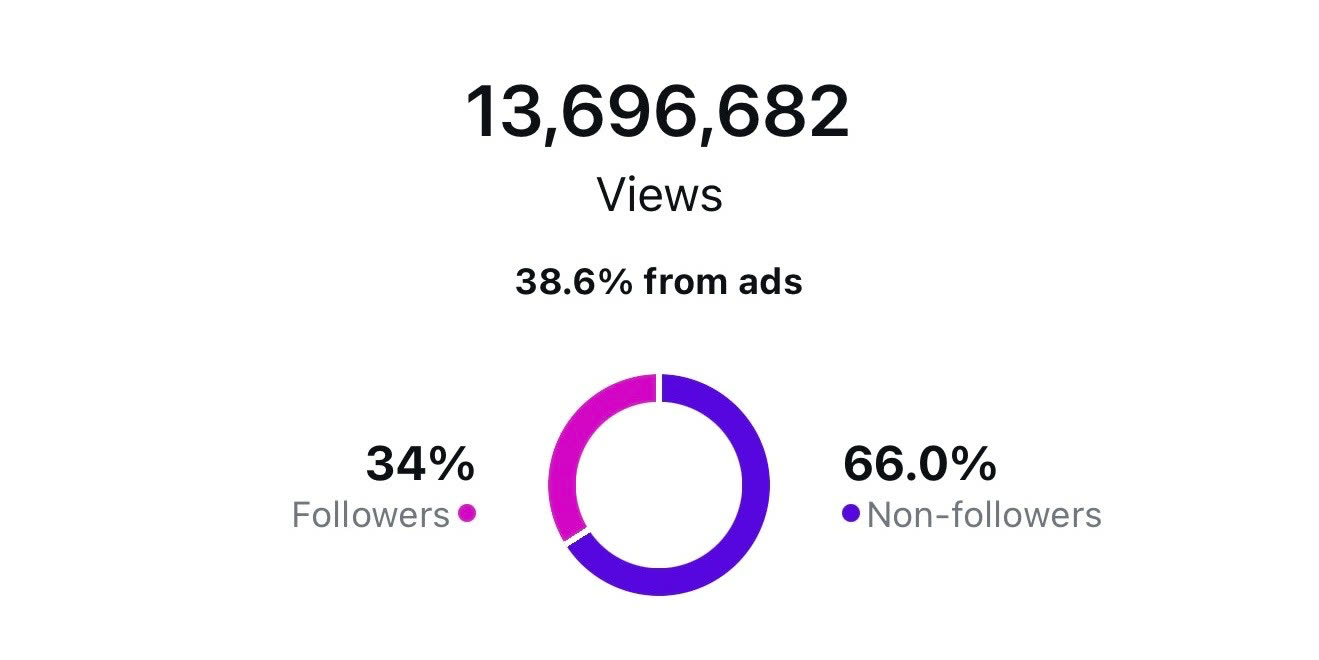
For one wellness brand it did, alongside several other changes, though Dream Aspect cannot say how many assets it took because we have not published that figure. Over 2025 we produced organic and paid content for the brand and published the result as a case study on its Instagram growth. Instagram views rose 350%, a 4.5x increase, and Instagram shares rose 94%. On TikTok, likes rose 577.32% to 236,756 and shares 474.84% to 11,422, and within the first two weeks a reel hit 200,000 views.
A case study without caveats is an advertisement, so here are four:
- The asset count is not published. This section asks whether volume worked and cannot fully answer it, which is a gap in our own reporting.
- It was not volume alone. The engagement included a 72-slide strategy deck and ran on a stated format thesis, "edutainment," entertain before educate, with carousels as the deliberate bet. We ran the audit before commissioning production, but the case study lists deliverables without a sequence, so take the ordering as our claim. The method is written up in our deep-dive on the format strategy.
- Roughly two fifths was paid. Our own pages put the ad contribution at 38.6%, 40% and 41% in three places, and we have not reconciled them. This was never an organic-only result.
- Two figures on our own pages do not reconcile. Instagram engagement growth is 58.31% on the case study and 58.41% on our homepage, and the case-study headline's absolute start and end view counts do not match the published growth rate. This article uses neither, and both are on our fix list.
Working out your number for next quarter?
Send Dream Aspect your paid spend and your current creative count, and we will run the win-rate arithmetic with you, including the cases where the answer is that you are already producing enough. We produce in Los Angeles and work with DTC brands across the US, across UGC, video production, paid creative and CGI.
Want to price the monthly volume you just worked out? The Dream Aspect pricing calculator shows the price on the page: choose a one-off shoot or a monthly plan, then add or remove deliverables such as a shoot brief, priority delivery, CGI or UGC.
Build your quote on the pricing page →
Prefer to talk it through? Talk to us → or book a 15-minute call from the pricing page.
Key takeaways
- At the ~5% win rate Motion measured across $1.29B of Meta ad spend, paid creative testing needs roughly 20 creatives per winner on average, and about 45 for a ~90% chance of at least one winner.
- One properly structured TikTok campaign needs 9 to 25 creatives, by our multiplication of TikTok's 3–5 creatives across 3–5 ad groups.
- Brands post about 20 times a month on Instagram, but Buffer and Dash Social disagree, so no organic optimum is settled; consistency is better evidenced than volume.
- Refresh creative before performance declines: in Meta's split test, acting on fatigue guidance improved conversion by 8%.
- Twenty UGC videos at Dream Aspect's published $350 floor is at least $7,000, a lower bound rather than a quote.
Frequently asked questions
How many videos a month does a DTC brand need?
There is no single number. For paid testing, Meta ad data from Motion suggests about 20 creatives per winner on average at a ~5% win rate, and about 45 for 90% confidence. For organic, brands average roughly 20 Instagram posts a month, which reflects what brands do rather than what works best.
Does posting more often on Instagram work?
It is unsettled. Buffer's analysis of 2.1M posts found follower growth rising with frequency, while Dash Social's analysis of ~1.5M feed posts found engagement rate peaking at 2–3 posts a week. Both are vendor studies of their own customers, neither is experimental, and they disagree, so no organic optimum is proven.
How many ad creatives do I need?
About 20 per winner on average. Motion's analysis of $1.29B in Meta spend found about 5% of creatives become winners. TikTok's documentation recommends 3–5 creatives per ad group across 3–5 ad groups; multiplying that out gives 9–25 per campaign, which is our arithmetic rather than TikTok's recommendation.
How often should I refresh ad creative?
Before performance declines, rather than on a calendar. Meta reports conversion likelihood is associated with a ~45% drop by the fourth repeated exposure, and that acting on fatigue guidance improved conversion by 8% in a two-cell split test across roughly 26,000 cases. TikTok advises refreshing when delivery trends decline, and Meta notes that targeting new audiences can solve the same problem.
Is quality or quantity more important for video ads?
Quality. TikTok, which sells the ad inventory that more creative would fill, reports that high frequency "cannot save poorly performing ads." Motion, whose platform is bought by high-volume advertisers, says winners are statistical outliers and that testing more ads gives more chances to find one. Volume buys more attempts at an unchanged success rate; it does not improve the creative.
What does 20 videos a month cost?
At least $7,000 at Dream Aspect's floor. Our UGC pricing starts at $350 per video with a five-video minimum, Dream Aspect's homepage lists social-media video packages from $3,000 per shoot, and 2D CGI runs about $70 per second on average. Because $350 is a floor and one production can yield several creatives, the multiplication is a lower bound, not an estimate.
Does Dream Aspect publish a monthly package?
Not yet. Dream Aspect publishes per-unit rates instead: from $350 per UGC video with a five-video batch minimum, from $3,000 per social-media video shoot, and around $70 per second for 2D CGI. The first two are floors, so multiplying them gives a lower bound; the CGI figure is an average that can move in either direction. Complex 3D runs $300–1,000+ per second.